
Graphical Abstracts: Merging Science and Art
- Lucy
- Jun 11, 2018
- 6 min read
As scientists, sharing the results of our research and having them be helpful is some way is our ultimate goal. Whether we are disseminating information to government, NGOs, other scientists, industry, or members of the public, it's ideal to be able to clearly and concisely sum up the research and get the main points across. However, that's often easier said than done - when a research project takes months or years of planning, executing, analyzing data, and writing up results, and the people we are sharing with have varied levels of knowledge and understanding of our topic, summarizing research efficiently can seem a daunting task! On the other hand, scientists must also keep up to date on the latest research occurring in our field, but often time constraints mean that reading (and understanding) every single new publication, especially those that are more tangential to our area of knowledge, simply isn't practical. Lastly, in our world where information and news is often shared over limited-character and image-heavy social media, a full-length scientific article isn't going to get a lot of traction unless it's got that extra "something" to catch a reader's attention. So, how do we create concise, eye-catching summaries of our research that are shareable, interesting, and comprehensible to readers with a wide range of backgrounds? A graphical abstract might be just the thing!
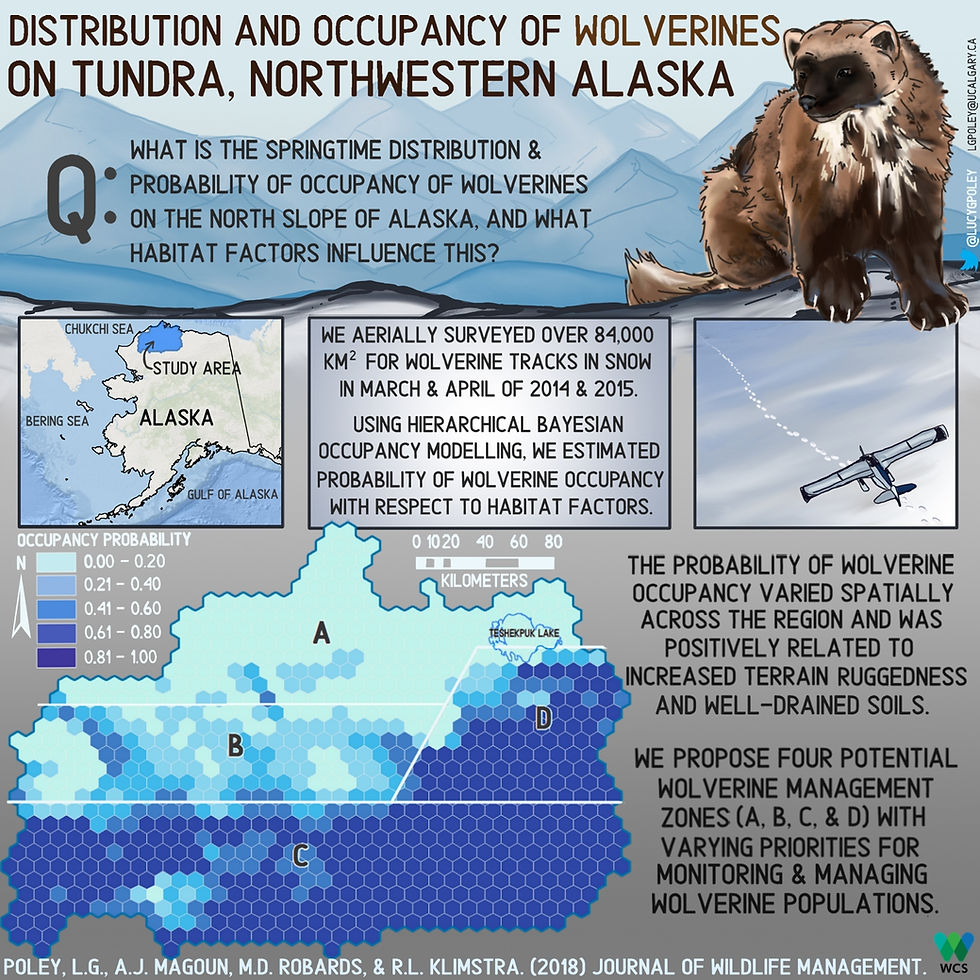
The first graphical abstract I created was for my own paper on wolverine distribution in Alaska. Click the image to read the full article.
A graphical abstract is a single image or figure designed to accompany a publication, providing a quick overview of the key points of the research. It's not just about reproducing one of the figures from the paper - it's more about visualizing the publication's abstract in a way that concisely "tells the story" of the research project. Depending on the audience, graphical abstracts can be tailored to use language and imagery that appeals to different folks - for example, a graphical abstract being shown at a technical conference might be different than one shown at an elementary school. And of course, being a visual representation of scientific information makes graphical abstracts perfect for sharing on social media, putting in blog posts, and even re-purposing as conference posters or figures in a report.
Some journals now allow or even require authors to submit graphical abstracts along with their papers; however, even if a journal doesn't accept them doesn't mean a graphical abstract won't be useful for you. Creating a graphical abstract to accompany your paper when it's shared online will bring attention to your work and allows reader, even those without a lot of knowledge on your subject matter, to quickly grasp the story of your research. In my experience, sharing a graphical abstract with a link to the paper it accompanies gets way more engagement on social media than just the link itself.

My second abstract was for a collaborator, Martin Robards, for WCS Arctic Beringia's very cool research on rats coming off of shipwrecks in the Aleutian Islands and the subsequent risk to seabirds. Click the image to read the article.
I've created four graphical abstracts in 2018, and hope to work on some more soon. Over the course of this process I've learned some valuable things about what does and doesn't work for graphical abstracts (at least in my field of ecology). Read on for my tips on maximizing your graphical abstract's utility and awesomeness.
Lucy's Graphical Abstract Tips
Be concise! This is maybe the most difficult part of graphical abstract creation, in my experience - distilling the essentials of your research down to a point where they can be represented in a single figure. In my abstracts, my goal is to make the font large enough that the text can be read on a phone. This means I'm fairly limited in how much I can write, but it's really hard to determine what the most important points are (especially when it's your own research). I usually first create the layout of the abstract so I know how much space I have to write, then write out the copy and edit it down until it fits that space in a readable font size. If you have a hard time trimming your own writing, you could show it to someone else and see what their interpretation of the main points is. A busy abstract with lots of tiny words won't attract readers - one with a minimum of readable text combined with bold graphics and titles will.
Use good design principles! This is where the "art" in "merging science with art" really comes into play. A basic knowledge of fonts, colours, layouts, and design will really come in handy when creating your abstract. Try to use a refined palette of colours, don't mix up too many font styles, and above all, keep it simple. A busy or complicated abstract will confuse people and they won't bother to spend the time figuring it out; conversely, a well-designed, eye-catching abstract that is easy to understand will quickly engage readers and is more likely to be shared. In my abstract designs, I first pick my colours and fonts (usually based on the topic of the abstract), then create a basic layout to work with. Since (so far) the papers I've worked on have been ecological, I try to include a larger image of the study species and one of the key figure (i.e. a map, a phylogentic tree), then a couple of smaller figures showing the study area, a portrayal of the methods, or some other key piece of the research. Whatever your style, make sure it complies with good graphic design principles for maximum effect. Lastly, keep in mind that some people may have difficulty reading certain font sizes, colours, or styles; for example, I used an all-caps font for two of my abstracts but then learned some people with reading difficulties have a harder time with capital letters, which I will keep in mind.
Know your audience! The style and contents of your abstract can be fairly general, suitable for most people, or they might be more specific. For example, if you're using the abstract to present at a conference with your peers or to share on a network of people in your field, you might include more technical terms than if you were presenting to an audience of the public, sharing in the local newspaper, or going to a school. Similarly, different fields might lend themselves to different abstract styles. Someone researching chemical reactions might find a labelled flowchart to be the best for conveying their work, while my research on the geographic distribution of wolverines was easily summarized with a map. Whatever style you choose, make sure it will resonate with your audience through your choice of contents, terminology, and design.
If you can't make one, find someone who can! Graphical abstracts are increasingly in popularity, but the less artistically-minded may see them as out of reach. But don't despair - there are plenty of excellent graphical abstract artists out there who can help, many of whom are both scientists and illustrators. If you see someone else's abstract and think it's awesome, don't be afraid to reach out and ask if they're available to make one for you! Generally, the more information you can share with the artist on what you envision the abstract to be, the smoother the design process will go; for example, sharing what you might like to see in terms of content, colours, imagery, and designs with the designer will help them to produce an abstract that fits your needs and vision. Supporting folks in the SciComm and SciArt fields is a great way to get yourself a cool abstract AND help out hard-working artists.
Share it... a lot! There's no point in having a graphical abstract if you aren't going to use it! Share your abstract (with links to the full article) on social media to maximize its utility. I purposefully design my abstracts in a square format because social media platforms like Twitter and Instagram work best with square images. I also keep in mind what the preview will look like on these platforms - Twitter tends to cut off the top and bottom of images in preview, so I make sure something eye-catching in right in the middle, versus Instagram, which just shows a smaller thumbnail of the whole image. Graphical abstracts can also be included in blog posts, on websites, in presentations and on posters, and even printed out and hung on the wall (how old school). The more you share it around, the bigger an impact your abstract is going to have

Another wolverine abstract, this time for a modelling effort in Ontario. This abstract was used on a Scientific American blog post!
I will continue to update this page with tips and tricks for graphical abstracts as I learn more, plus share the abstracts I've made. If you have any questions, comments, or want to commission an abstract of your own, feel free to send me an email: lgpoley(at)gmail(dot)com. Thanks for reading!
Lucy
UNICCM presents the auxiliary equation with a focus on illustrating its role in characterizing differential outcomes. You are guided through conceptual frameworks that enhance interpretive accuracy. Each topic is explored through clear academic reasoning. The auxiliary equation becomes a reference point for examining the behavior of dynamic systems. UNICCM cultivates an environment where careful analysis is encouraged. As you progress, the logical structure behind each solution becomes increasingly apparent. You are invited to strengthen your academic understanding through these structured studies.
Comparing certificate vs diploma pathways is an important step for anyone entering a new field. The College of Contract Management outlines the practical distinctions between both qualifications in a clear and accessible way. This helps individuals select the most effective option for career growth.
Rediscover inner balance and harmony with Tantra Therapy in Delhi at Sarv Wellness. Our expert practitioners guide you through mindful breathing, energy alignment, and meditative touch to awaken your senses and promote deep emotional healing. Tantra therapy focuses on connecting the mind, body, and spirit, helping release stress, improve intimacy, and enhance self-awareness. At Sarv Wellness, we provide a serene and private space where you can experience relaxation, rejuvenation, and personal transformation. Whether you seek emotional clarity or spiritual awakening, our Tantra Therapy in Delhi offers a holistic path to wellness and self-discovery.
Tantra Healing In Delhi
Tantra Therapies In Delhi
Cuddle Therapy In Delhi
Nuru Massage In Delhi
Wellness Center In Delhi
Osho Tantra Therapy in delhi
Looking to start your own car care business? The Detailing Mafia offers the best car detailing franchise opportunity in India. With a strong brand presence, advanced detailing technology, and premium-quality products, we help entrepreneurs build successful car detailing studios. Our franchise model ensures high returns, extensive training, and continuous support in operations, marketing, and customer service. Join The Detailing Mafia and become part of India’s fastest-growing detailing network, offering services like ceramic coating, PPF, steam wash, and more. Step into the world of luxury car care with a trusted name and make your business shine with The Detailing Mafia.
Car detailing
Graphene Coating
car detailing franchise
Ceramic coating
Paint protection film
When you explore jobs you can get at 16, you’re not just earning, you’re learning about what motivates and inspires you. These experiences can lead to a clearer sense of direction and purpose. For those interested in construction, project management, or engineering, UNICCM provides the perfect pathway to grow your knowledge. Their professional courses give you the tools to build confidence and competence early on. With flexible online study, you can work while learning from experienced lecturers. Every lesson and opportunity you take now will prepare you for greater achievements. Begin your path with UNICCM and watch your potential unfold beautifully.